Introduction
The objective of this activity is to be able to apply the key concepts involved in hypothesis testing.
Included in this is understanding and being able to apply the concept of statistical power.
Interpretation
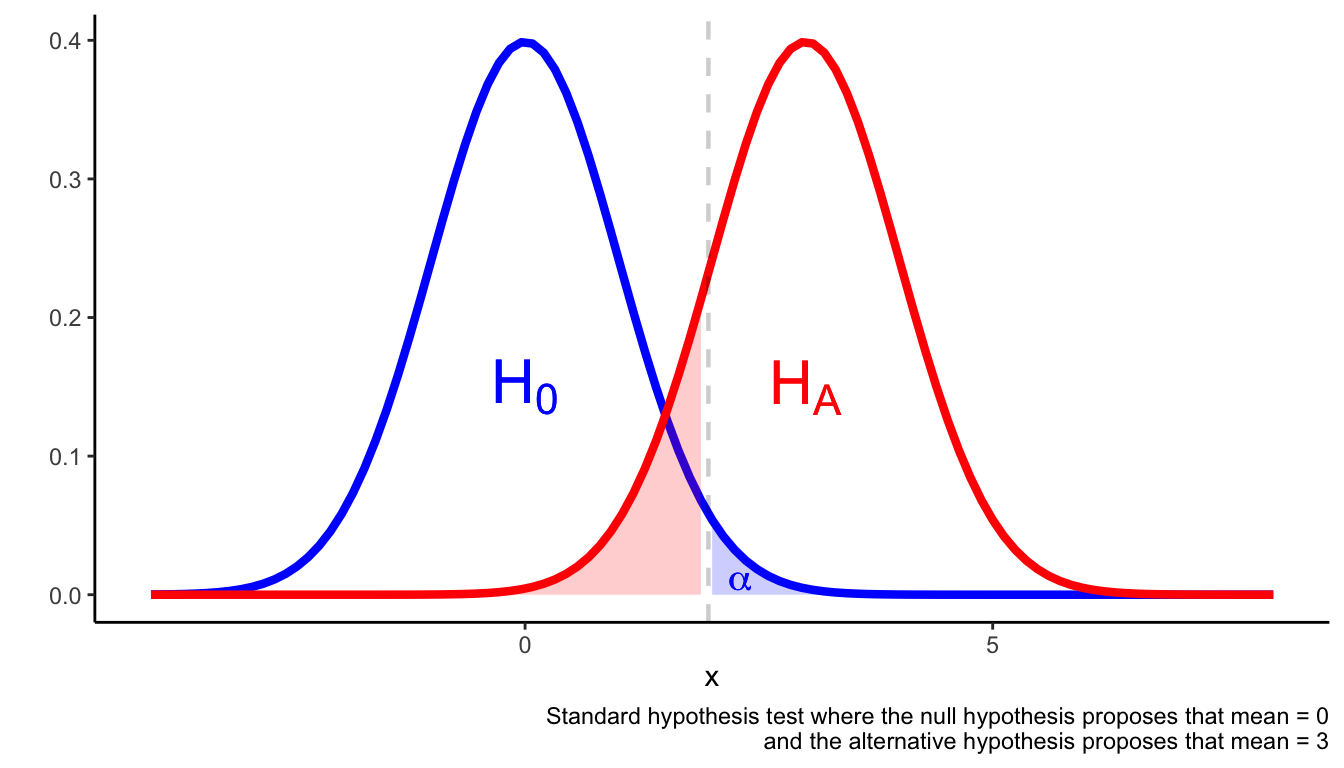
Standard hypothesis tests are set up in such a way that if the observed
data falls into the \(\alpha\) region, then observing such a result is
more likely if the alternative hypothesis is true compared to if the
null hypothesis is true. This is an important aspect of the
justification for rejecting the null hypothesis and accepting the
alternative hypothesis.
Assuming the outcome is a continuous variable that is normally distributed, the following figure illustrates the set-up of a hypothesis test.
A hypothesis test is set up in such a way as to avoid Type I and Type II errors.
Type I errors occur when you reject the null hypothesis when the null hypothesis is true.
Type II errors occur when you fail to reject the null hypothesis despite the null hypothesis being false.
One way to avoid type I and type II errors is to ensure the statistical test is adequately powered.
A suitable rule of thumb is that \(\beta \approx 0.2\) (which is equivalent to a power of 80%).
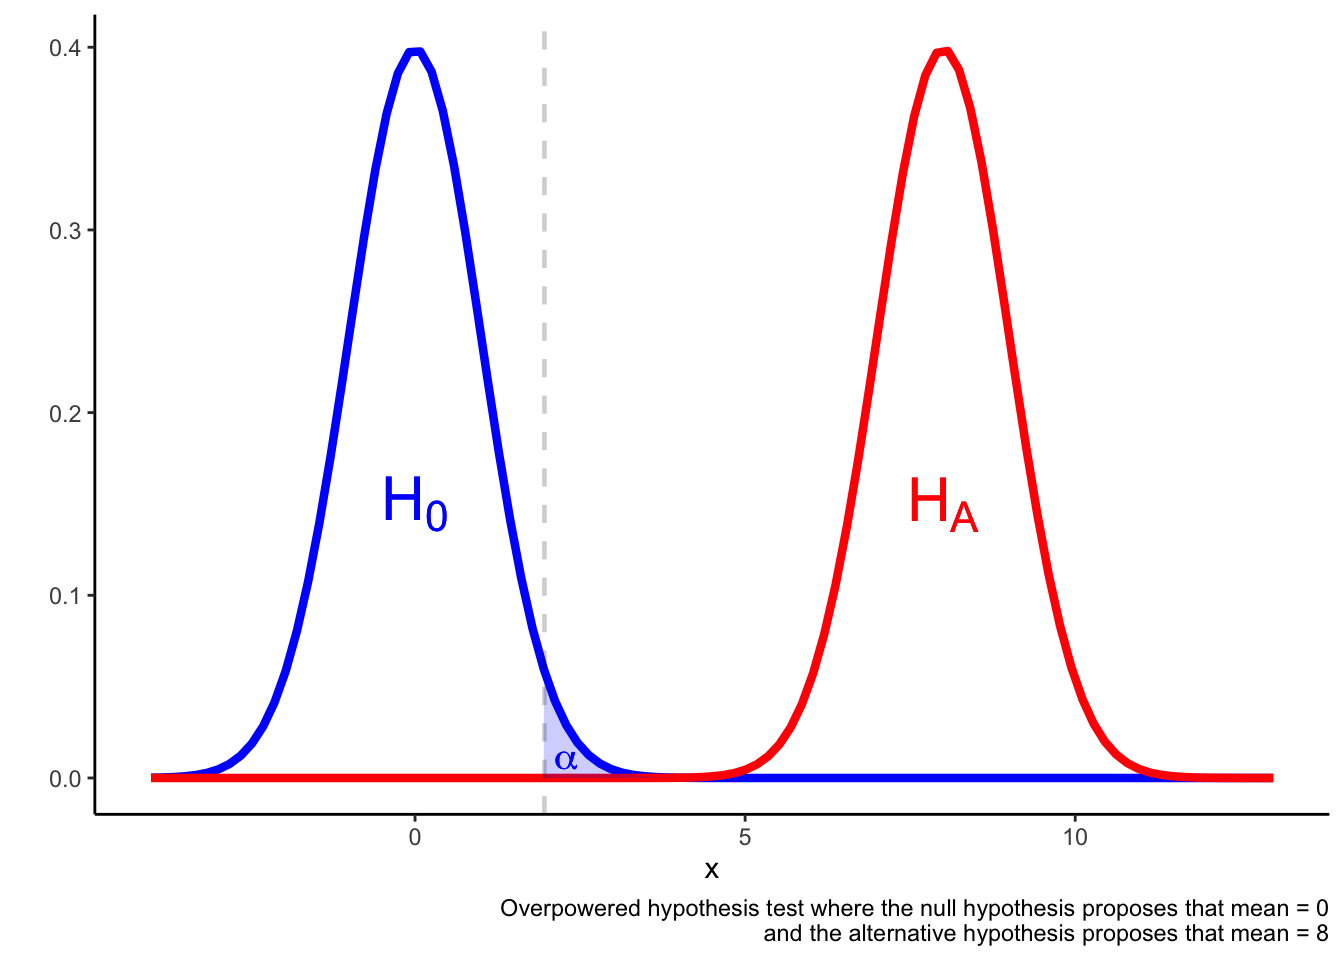
In an overpowered test, it may be the case that a result in the \(\alpha\) region is more likely if the null hypothesis is true rather than if the alternative hypothesis is true.
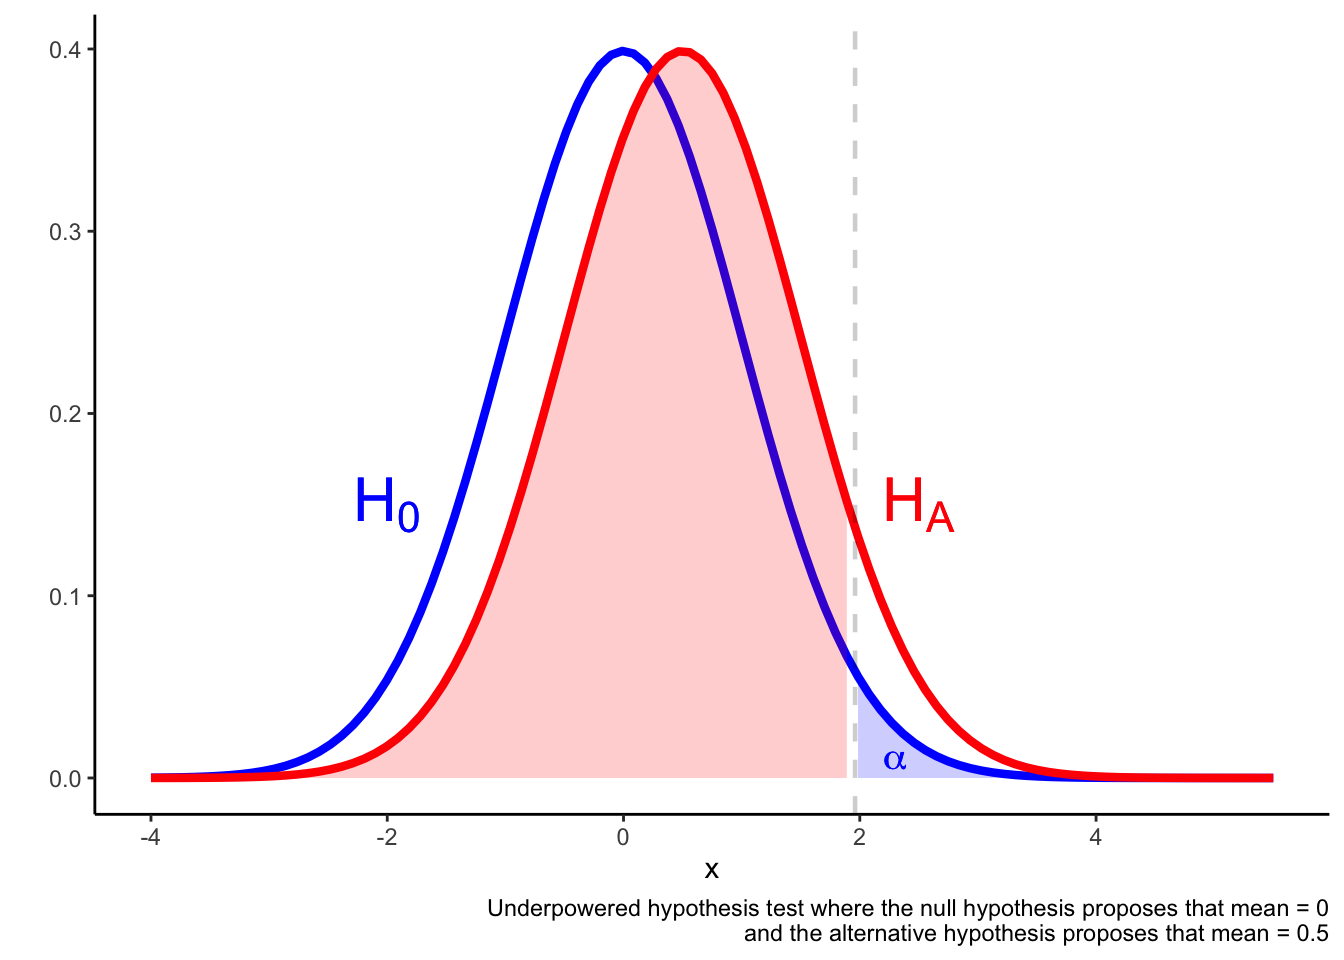
In an underpowered test, it may be the case that a result in the \(\alpha\) region is not much more likely if the alternative hypothesis is true compared if the null hypothesis is true.
In this situation, the result falling in the \(\alpha\) region may not be a reliable indicator that the null is false.
Setting up a hypothesis test
If you are doing a hypothesis test, you need to think about power.
The power of the test is considered before collecting any data, but after you have specified your research question and identified an appropriate statistical test.
At this point I am going to assume that you have already selected an appropriate statistical test.
You now need to determine how big you study needs to be to be able to reliably answer your research question.
The information you need will depend on the specific statistical test, but here are some general principles.
The statistical power of the test depends on:
Sample size: the larger the sample, the higher the power.
You also need to think about loss to follow-up, drop-outs and non-adherence to the study.
Estimated effect size: this is the effect size you are trying to detect (perhaps the difference between two means). The smaller the estimated effect size, the lower the power
This might be determined by existing evidence, or it might be the “minimally clinically important difference”.
Variability in the sample: the more variability in the sample, the lower the power of the test
Predetermined \(\alpha\), \(\beta\): standard values are \(\alpha = 0.05\), \(\beta = 0.2\), but if you change these, you will change the power of the test (obviously, I hope)
The best way to get across this is with examples—which we do later in the module.
For now it is enough to appreciate the determinates of statistical power.